SSRS Report: Lookup Functions
Resouces:
Scenario: Assume that a table is bound to a dataset that includes a field for the product identifier ProductID. A separate dataset called "Product" contains the corresponding product identifier ID and the product name Name.
In the following expression, Lookup compares the value of ProductID to ID in each row of the dataset called "Product" and, when a match is found, returns the value of the Name field for that row.
=Lookup(Fields!ProductID.Value, Fields!ID.Value, Fields!Name.Value, "Product")
=Lookup(Fields!ProductID.Value, Fields!ID.Value, Fields!Name.Value, "Product")
SQL Server 2008 R2 Reporting Services Lookup Functions
 | By: Ray Barley | Read Comments (4) | Print Ray is a Principal Architect at RDA Corporation and a MSSQLTips.com BI Expert. Related Tips: More |
Problem
I noticed a new Lookup function in SQL Server 2008 R2 Reporting Services. This sounds like something that I've needed for quite some time. Can you provide an example of how I can use this?
Solution
There are three lookup functions in SQL Server 2008 R2 Reporting Services: Lookup, LookupSet and MultiLookup. In this tip I will review each function and provide a simple report to show how it is used.
Lookup Function
I will use the following tables from the AdventureWorksDW2008R2 database in my sample report:
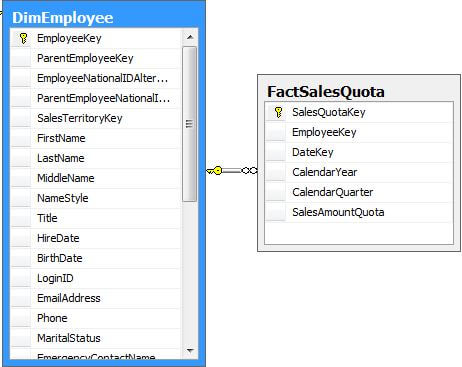
Assume that my report contains a Dataset for each table; e.g. SalesQuotaDataset and EmployeeDataset. I want to list the rows in the SalesQuotaDatset on the report and include the employee's name from the EmployeeDataset. You might be thinking why not just have a single dataset and get the employee name by a join. You can do that. However, the Lookup is the way to go, if what you have are two datasets and you cannot change the queries.
The Lookup function has the following parameters:
- source_expression - specifies the value in the current scope that you want to use as the lookup; e.g. EmployeeKey in the SalesQuotaDataset
- destination_expression - specifies the value that you want to match in the destination dataset; e.g. EmployeeKey in the EmployeeDataset
- result_expression - is what you want the lookup function to return; e.g. EmployeeName from the EmployeeDataset.
- dataset - is the name of the destination dataset; e.g. EmployeeDataset
The actual Lookup expression in my report is:
=Lookup(Fields!EmployeeKey.Value, Fields!EmployeeKey.Value, Fields!EmployeeName.Value, "EmployeeDataset")
The following is a portion of the output of my report:
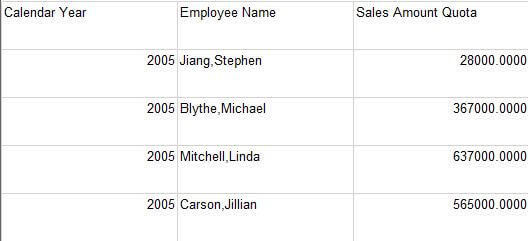
The EmployeeName column has the Lookup expression; the query for the EmployeeDataset concatenates the Last Name and First Name.
LookupSet Function
I will use the following tables from the AdventureWorksDW2008R2 database in my sample report:
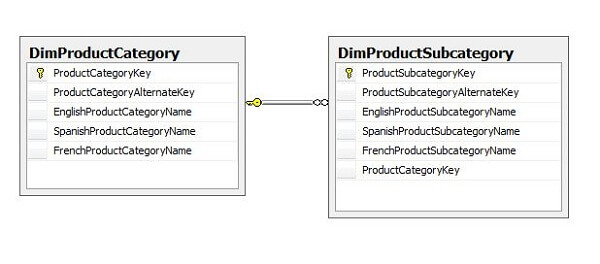
Assume that my report contains a Dataset for each table; e.g.ProductCategory and ProductSubcategory. I want to print each Product Category and include the list of its Product Subcategories, all on the same output line.
The LookupSet function has the following parameters:
The parameters are the same as Lookup function described above. However, the output of the LookupSet function (i.e. the expression_result) is the list of matching values in the destination dataset. In this case I want to get the list of EnglishProductSubcategoryNames for a given ProductCategoryKey in the ProductSubcategory dataset. In order to print a list of items inside of a single cell in a report, I will use the Join function which will transform the list of items into a single string and put in a comma to delimit each item. The following expression performs the LookupSet function and applies the Join:
=Join(LookupSet(Fields!ProductCategoryKey.Value,Fields!ProductCategoryKey.Value,Fields!EnglishProductSubcategoryName.Value,"ProductSubcategory"), ",")
The sample output from my report is shown below:
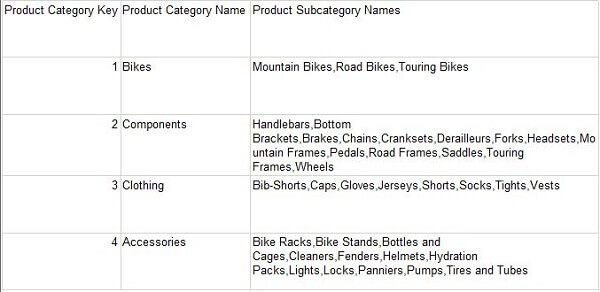
I used a PlaceHolder instead of a TextBox for the Product Subcategory Names. This opens up the possibility of rendering HTML instead of just plain text.
MultiLookup Function
I will use the following tables from the AdventureWorksDW2008R2 database in my sample report:
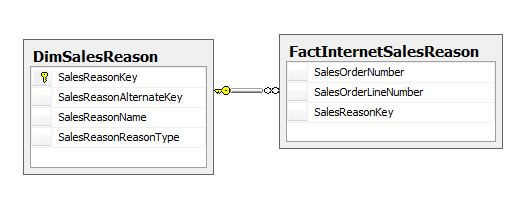
I want to create a report where the user can select one or more Sales Reasons from DimSalesReason then see which sales orders had any items that are tagged with any of these sales reasons.
The MultiLookup function has the following parameters:
The parameters are the same as the previous lookup functions except that the first parameter is actually a list of values. The report will have a Sales Reason parameter that allows multiple selections; the selected Sales Reasons will be printed in the report header. The report will list each sales order that contains any item that matches one or more of the selected Sales Reasons. My sample report is shown below:
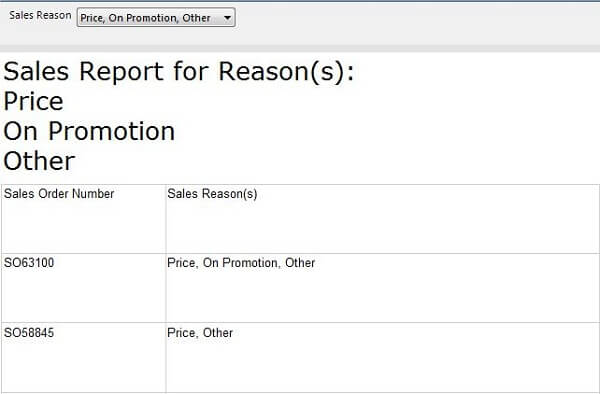
There are two lookup expressions used in this report; I'm using the following MultiLookup to retrieve the Sales Reason Name for each Sales Reason selected in the multi-select report parameter:
=Join(MultiLookup(Parameters!SalesReason.Value, Fields!SalesReasonKey.Value, Fields!SalesReasonName.Value, "SalesReason"), "
")
")
Note that since the Sales Reason parameter allows multiple selections, Parameters!SalesReason.Value is a list containing every value selected by the user. The above expression is rendered in a PlaceHolder that has the markup type set to HTML so I can show each Sales Reason on a separate line.
The second lookup expression is a LookupSet that retrieves the list of Sales Reasons for all items on the order:
=Join(LookupSet(Fields!SalesOrderNumber.Value, Fields!SalesOrderNumber.Value, Fields!SalesReasonName.Value, "SalesOrderReasonBridge"), ", ")
The SalesOrderReasonBridge dataset is using the following query which gets every Sales Order that has any items tagged with any of the Sales Reasons selected for the report and also grabs the Sales Reason Name:
Next Steps
- The Lookup functions are certainly a welcome addition to Reporting Services; hopefully they will work for the majority of our requirements.
- You can download the three sample reports here.
- You can download the AdventureWorks sample database for SQL Server 2008 R2 from CodePlex.
Last Update: 10/25/2010
posted by Masud Ahmed @ <$BlogItemDateTime
$>
0 Comments
![]()

